About the Contributor
Part Three: Measuring The Value of a Hit
March 5, 2019
“Would you rather have a batter who hit a single every time, or a batter who hit a home run once every four at bats?” At the age of seven, it was an interesting question proposed by my brother. We were no geniuses, but we could agree that the home run player would be more valuable. Although it did depend on the team’s scoring conditions, it made sense to go with a player who could score by himself.

By consulting a few rudimentary statistics, the error in our judgement is clear. While slugging percentage indicates both hitters would be getting the same amount of total bases per at bat, on base percentage indicates the value contributed by the singles player by avoiding outs is far more valuable then the home run player’s ability to generate their own offense. But how do we know this is the truth?
Using the same linear weight methodology used to determine the value of a successful and unsuccessful steal attempt, the value of each event can be determined. First, in each base-out arrangement, you determine the value of each outcome by comparing the event’s expected outcome’s run expectancy to the run expectancy prior to the event. Then you multiply each event’s values and average them, weighed based on the frequency of each base-out arrangement. This results in each event’s context neutral value:
| Event | Value (in runs) |
| Single | 0.498 |
| Double | 0.866 |
| Triple | 1.251 |
| Home Run | 1.659 |
| Walk or Hit By Pitch | 0.442 |
| Out | -0.370 |
By setting the value of an out to zero (thus increasing the value of the other events by .37) and creating a slugging percentage style equation, you arrive at the GMHS version of wOBA:
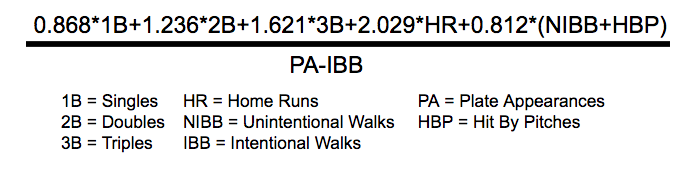
It’s not perfect – the run scoring environment changes year to year – but it provides a more precise way to evaluate the values of mason players. For example, let’s go back to comparing the singles player and the home runs player. In mason baseball, the player who hits a single every time would be worth .868 runs per plate appearance while the player who hits a home run every four plate appearances (and gets out the rest) would be worth 0.507 runs per plate appearance. By choosing the player who hits home runs, we’d be losing .351 runs per plate appearance, over one per game. For the home runs player to be worth it, they’d have to hit a home run in 43% of their at bats. These values, and their variations by base-out arrangement, can be used to also construct optimal lineups and provide insight to potential systematic error in fielding arrangement.