The Hypocrisy Of The MLB MVP Finalists
November 15, 2018
 On November 5, the Baseball Writers Association of America announced the finalists for the American League (AL) and National League (NL) Most Valuable Player (MVP) awards.
They announced the three finalists from each league, or the players that will finish in the top three in the voting for both the AL and NL MVP awards. For the AL, these players were Mookie Betts, Mike Trout, and Jose Ramirez. For the NL: Christian Yelich, Javier Baez, and Nolan Arenado. Out of these finalists, two huge controversies arose.
First, JD Martinez was not among the AL MVP finalists. As recent as 2013, JD Martinez might have been considered the favorite. He specialized in the “triple crown” statistics (home runs, batting average, and runs batted in) finishing top two in all three categories. He was a favorite of anyone who prefers traditional statistics, but advanced metrics poked a few holes in his candidacy. bWAR (baseball reference WAR) indicates that, as valuable as he was as a hitter, he was only the ninth most valuable player in the AL due to subpar baserunning, fielding, and playing easy positions (DH/LF/RF).
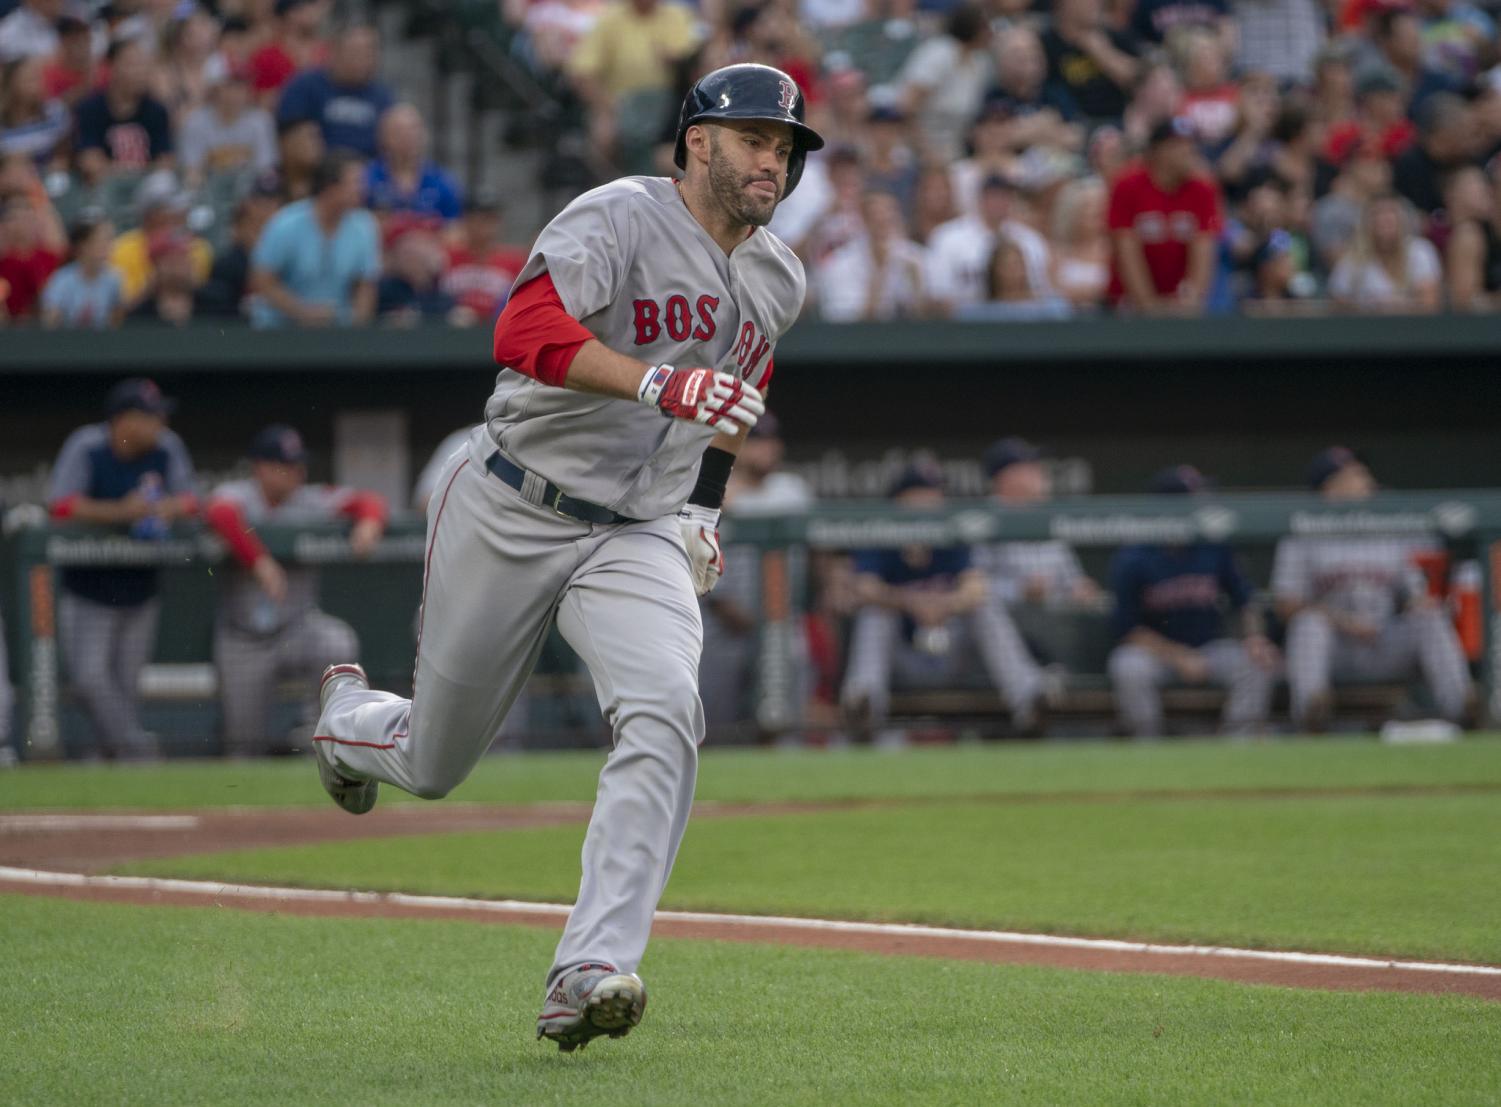
From an analytical perspective, this indicates a breakthrough. In 2012 and 2013, Miguel Cabrera won back to back AL MVPs over Mike Trout due to superior triple crown statistics despite bWAR indicating he was two to three wins less valuable than Trout. Despite batting sixty points lower, hitting four less home runs, and driving in twenty five less runs, Jose Ramirez was selected over JD Martinez. Why? Ramirez is a great baserunner, an above average defender, and plays a difficult position.
| Name | Batting Value (Rbat) | Baserunning Value (Rdp+Rbaser) | Fielding Value (Rfield) | Position Value (Rpos) | Runs Above Average |
| JD Martinez | 59 | -4 | -5 | -11 | 40 (off due to rounding) |
| Jose Ramirez | 39 | 8 | 3 | 3 | 53 |
For a player to overcome such a large gap in triple crown statistics says a lot about voters increasing trust in WAR, at least for position players.
The NL MVP finalist class proved to be an analytical disaster. Over the course of MLB history, the average bWAR for MVPs has been about 7.5. So while cases could be made for Christian Yelich (7.6), Javier Baez (6.3), and Nolan Arenado (5.6), the front runners should have been Max Scherzer (9.5), Aaron Nola (10), and Jacob deGrom (10). Unfortunately, MVP voters HATE pitchers.
To put in perspective the quality of the seasons of Scherzer, Nola, and deGrom, Bryce Harper had a bWAR of 10 in his unanimous MVP decision in 2015. What got Harper unanimous MVP in 2015 got Nola and deGrom fourth and fifth place at best, behind someone more than four wins less valuable (Arenado).
Why do MVP voters discriminate against pitcher? The debate boils down to two outdated arguments: ‘Pitchers can’t be as valuable as position players’ and ‘pitchers have their own award’. WAR (no matter the version you choose), popularized in 2012, cuts right through the myth that pitchers can not be as valuable as position players, so the only remaining argument for not voting for pitchers is the notion that ‘they have their own award’.
In 1956, the Cy Young award was created to recognize the best pitcher in the major leagues. In 1967, the award expanded to recognize one pitcher per league and, besides voting changes, the award has not changed since. Serving as a sort of MVP award for pitchers, pitchers began winning the real MVP award less (see below).
| Description | Years | Proportion of MVPs Won By Pitchers |
| Pre Cy Young award Era | 1911-1955 | 14/71 = 0.197 |
| MLB Cy Young award Era | 1956-1966 | 2/22 = 0.091 |
| AL & NL Cy Young award Era | 1967-1998 | 7/65 = 0.108 |
In 1999, the Hank Aaron Award was introduced to recognize the top hitter of each league. Finally, position players had an award that served as their equivalent to the Cy Young award. It should have been expected for a rebound in the number of pitchers winning the MVP, unfortunately, the opposite occurred.
| Description | Years | Proportion of MVPs Won By Pitchers |
| Pre Cy Young award Era | 1911-1955 | 14/71 = 0.197 |
| MLB Cy Young award Era | 1956-1966 | 2/22 = 0.091 |
| AL & NL Cy Young award Era | 1967-1998 | 7/65 = 0.108 |
| Hank Aaron Award Era | 1999-Current | 2/38 = 0.053 |
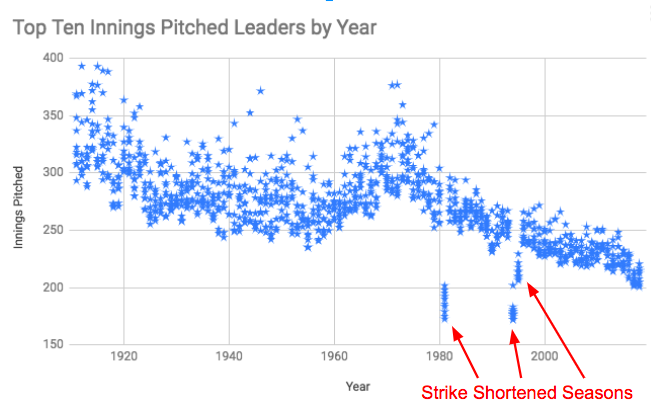
In part due to the Hank Aaron Award failing to recognize MVP winners, the award never gained much traction. With the effects of the newly implemented Hank Aaron Award not canceling out the fact that top pitchers throwing fewer innings (see below), the proportion of MVPs won by pitchers continued to decrease.
In a way, the hypocrisy in the use of analytics, the voting discrimination against pitchers despite knowing better can be attributed to the lack of respect for what the Hank Aaron Award stands for. If it held more weight, perhaps as much as the Cy Young award, then the MVP award could actually be for the most valuable player. This is no matter of disrespect to Hank Aaron himself or the people who vote for the award, but the Cy Young and MVP awards have tenure. They mean something because they are a means of comparing the dominance of players now to those of the past.
The MVP award winners will be announced at 6 p.m east coast time on MLB network.