The Not So Tough “Tough Loss”

Picture of Jacob deGrom. deGrom dominated the National League in 2018 striking out 269 batters in 219 innings. (Photot via Wikimedia)
November 20, 2018
Terminology:
WAR = Wins Above Replacement, single number to estimate the value of a player.
MVP = Most Valuable Player award, awarded to one player from each league at the end of the season.
ERA = Earned Run Average, how many earned runs a pitcher allows per nine innings.
Game score = A metric that attempts to put a single number on the quality of a starting pitcher’s performance, 50 being average.
R/G = Runs per game per team, how many runs the average team scored per game.
IP = Innings Pitched
R = Runs Allowed
———————————————————————————————————————
“How could deGrom have a WAR of ten if his team loses so much when he pitches?”
My father, like many from the pre-Moneyball era, is still attached to wins and losses as a way to evaluate pitchers. I can not blame him; it is a gaping hole in his MVP candidacy. Despite his league-leading 1.70 ERA, Jacob deGrom wound up with a win-loss record of 10-9 in 2018.
Fortunately for deGrom, he lives in an age of advanced analytics. WAR isolates the value of deGrom’s performance relative to what a “replacement level player” would have done. So even though the Mets went 14-18 with deGrom pitching, he contributed about ten games of value. He also led the league in tough losses, a metric to indicate the amount of unlucky losses.
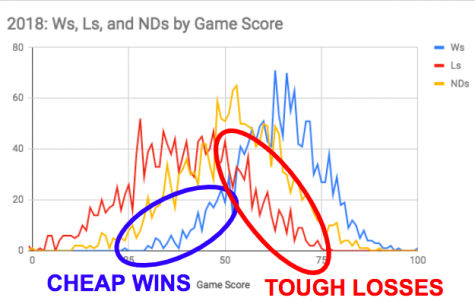
Tough losses and its counterpart, cheap wins, are based on Bill James’ game score metric. This metric attempts to put a single number on the quality of a starting pitcher’s performance, 50 being average. A loss is tough when the pitcher pitched above average (game score > 50) and a win is cheap when the pitcher pitched below average (game score < 50). It is a nice concept to compensate pitchers like deGrom for being on a terrible team. Unfortunately, the concept of tough losses and cheap wins is heavily flawed. It inherently misguides users of the statistic.
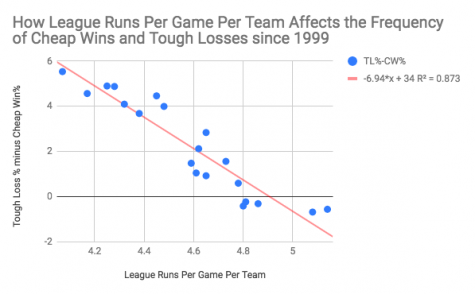
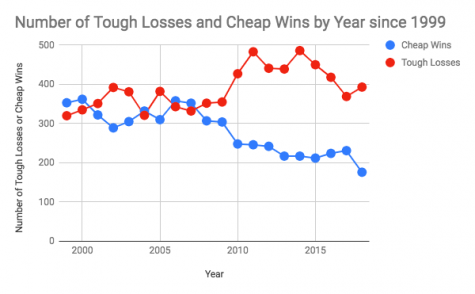
For one, the game score is not era adjusted. A game score of 50 in 1930 (league R/G = 5.55) is a game score of 50 in 1968 (league R/G = 3.42) despite it being much more valuable in 1930 than in 1968. This leads to various years having different mean game scores. In 2018, that mean game score was 51.5 yielding a gap of 217 between cheap wins and tough losses. As the graph below shows, this has generally been the case since 2010. Because the dividing line of tough wins and cheap losses does not move with the league mean game score, high scoring periods in baseball history will have an influx of cheap wins while low scoring periods will have an influx of tough losses.
This leads to confusion in evaluating the luck for pitchers like Mike Minor in 2018, who got four tough losses and four cheap wins. To many fans, it may appear his luck was neutral when in reality he was one of the luckiest pitchers in 2018. Based on the ratio of cheap wins to tough losses in 2018, Minor would have needed nine tough losses to be considered unlucky (purely in terms of cheap wins and tough losses).
My second problem with the current system is how it handles no decisions. While Jacob deGrom received a lot of losses he did not deserve, he was really robbed in games where he received neither a win nor a loss. He has no number compensating him for the no-decisions this year for going 6-1, 7-1, 7-1, 7-0, 7-0, 8-1, 8-1, and 8-0 (presented as IP-R). Even if it leads to a “tough no decision” and “cheap no decision” category (please no), there needs to be some form of recognition for varying levels of no-decisions.

The final issue with any binary system regarding the deservingness of a win/loss is that they do not properly represent probability. When a pitcher pitches well, he should not be given one full “deserved win”. Rather, he should be given both the probability of his performance (however you measure it) yielding a win and the probability of his performance yielding a loss. So the general formula for a player’s deserved wins/losses should be the sum of these game by game win/loss probabilities.
I ran two versions of this probability based system, one based off of IP-R combinations, the other off of game score. I only used data from 2018 and did not use a line of best fit. According to the IP-R combinations system, deGrom deserved to get 16.6 wins and 5.1 losses. By the game score system, he deserved 18.3 wins and 3.6 losses. Either way, these estimations show that deGrom’s mediocre record was not the fault of his own.