Breaking records with weird rules
Part One: How to break the single season wins record
February 4, 2019
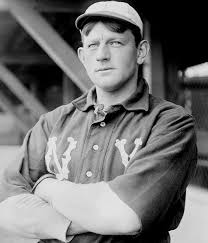
Jack Chesbro’s 41 wins in 1904 defines his legacy. In an era where reaching half that mark is enough to lead the league, it seems like he will be the permanent holder of this “unbreakable” record. Unfortunately for him, a look at recent history and the rule book can help pick this record apart.
Problem: Chesbro threw 454.2 innings in 51 games started in 1904. Nowadays, the leagues top pitchers barely get over 200 innings pitched and 30 starts. So in trying to break this record, it is key to try to find ways of getting wins without forcing the pitcher to throw too many innings.
History: An example of how to accumulate wins while minimizing innings can be observed from the 2018 Tampa Bay Rays. In the Rays’ experiment of “the opener”, Ryan Yarborough was frequently the long reliever that would follow the first pitcher. This allowed him to inherit any lead “the opener” had created and avoid having to throw five or more innings (as he would have needed to as a starter). As a result, he managed 16 wins in 147.1 innings, 14 of the wins as a reliever.
Rule book: A fun little specification a starting pitcher must follow to get an “official” win is to pitch five or more innings. If a starting pitcher has a lead but is removed for a reliever before pitching five innings, then the reliever is put in line for the win. It’s a messed up way of awarding the win, but that could be gamed for advantage. In any early blowout, I could remove the starting pitcher right before he reaches five innings pitched and bring in another pitcher for whom I was trying to maximize the win total. This would essentially be a more extreme version of how the Rays used Yarbrough; instead of having the starter pitch one inning and Yarbrough pitch four innings, the first pitcher would pitch four innings and second pitcher (the one I’m trying to get wins) would only pitch to one batter.
Results:
To get an idea how many wins this strategy would yield, I ran through the game logs of the Los Angeles Angels (the most mediocre team in 2018). In games of which the Angels held a lead as the opposing team came to bat in the fifth inning. If that lead was held for the remainder of the game, the chosen one gets credited for the win (assuming the starter lasted until then, but I’ll address that in a sec). To simulate how the chosen one performed, I assumed he did what the pitcher he replaced did.
Assuming the Angels’ starting pitchers always lasted until the chosen one was brought in, the strategy would yield 43 wins. Unfortunately, starting pitchers falling short of this mark costed the chosen one three wins and therefore, he fell just one win short of Chesbro’s record. Since the Yarbrough strategy only required him to pitch 28.2 innings, the manager has roughly 30 innings to pitch him in the 102 games (40 wins within them) he went unused to just get him one more win.
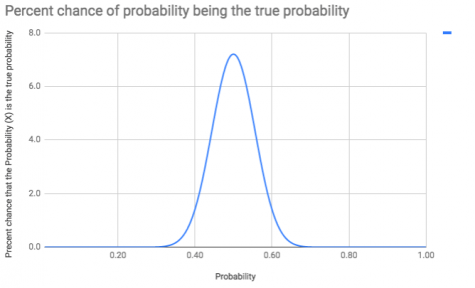
This simulation works out very cleanly in the sense that it suggests this strategy would yield a win for the desired pitcher in half of a given team’s wins (since this test runs yielded 40 in 80 total wins). With the amount of data points collected, I can be about 92% sure the true yield percentage is between 40% and 60% (see chart above).
Probability of a team win being a Yarbrough win
Expected team wins needed to beat record (get 42 wins) using only the Yarbrough strategy
0.6
70
0.5
84
0.4
105
Using an optimal strategy, breaking this record requires a mediocre team, players with minimal egos, and a little bit of luck.